
You care about your driver’s center of gravity location.
You may not realize it yet, but you do. CG location has a significant influence on how your driver performs. While the average golfer may not know what center of gravity is, or why it matters (in fact, he may not think he cares), there’s a reason why it (CG) is a part of the discussion that accompanies nearly every driver release. High launch, low spin, and super-forgiving, better performance is made possible by the mass properties of the club and the resulting CG locations.
Low and back CG is a mainstay of driver marketing. Low and forward had a run for a bit too. Cobra went Zero CG, Callaway went Sub Zero, and everybody is always moving things around trying to do better, or at least different, than the last time around.
But what does any of that mean, and of equal importance, who is telling the truth about CG location?
That’s what this annual post is all about.
Today we’re going to show you exactly what’s real when it comes to the actual center of gravity placement of this season’s hottest drivers. By the time we’re done, hopefully, you’ll understand why CG matters too.
For those of you who are stumbling across our CG charts for the first time, and may be wondering what they are, and why they matter, we’re not going to rehash all of that here. I would encourage you to check out any and all of our previous posts on the topic.
- Golf Geeks – How Center of Gravity Makes a Huge Difference
- 2015 Driver CG Data
- 2016 Driver CG Data
- 2016 Driver CG Data Update 1
- 2017 Driver CG Report

THE FINE PRINT
Before we get to our charts, it’s important to understand that although heads were measured according to USGA standards, tolerances (both in measurement and in manufacturing) come into play. The tolerance for our measurements is approximately .7mm. To account for this, we represent CG using large dots rather than a smaller absolute point.
We should also note that of the companies that publicly state driver CG locations, most do so based on measurements from CAD drawings. Between manufacturing, assembling, welding, and polishing, CAD projections don’t always align with the finished product. Our data comes from actual retail parts.
Where the dots in our charts are touching or are in close proximity to one another, it’s reasonable to assume the heads have similar performance characteristics.
Finally, although we’ve blown these charts up to make them a bit easier to read, every last one of the CG locations represented is within that tiny little 14mm x 12mm box previously described in our CG Primer.

Share it with your foursome Share on Facebook
Interacting with the Charts
For each of the charts displayed below, we’ve defaulted to mostly new (2018) drivers. We’ve listed the PING G400 Series and the PXG 0811x as 2018 because they were released after our 2017 report was published. Note that the observations made below are specific to our 2018 models.
The provided filters allow you to add or remove clubs based on any combination of Year, Manufacturer, and Model. We recommend that, for additional context, you view the charts with previous year’s models selected. Additionally, you can:
- Click on any model name at the top of the chart and then click the highlight icon on the extreme top right to isolate that club or clubs
- Hold down Ctrl while clicking to isolate multiple clubs
- Hover over any dot to reveal additional information, including the relevant weight setting and the actual measurements
With all of that out of the way, let’s get to out 2018 data:
CG YZ (CG RELATIVE TO FACE CENTER)
The chart below shows the YZ (top to bottom/front to back) CG location relative to the center of the face for the drivers measured. Effectively, the area shown represents that 14mm x 12mm box within the clubhead. These measurements depict CG locations without consideration for their relationship to the neutral axis. As such they are not loft dependent. Basically, the chart shows the actual CG location for each driver measured.
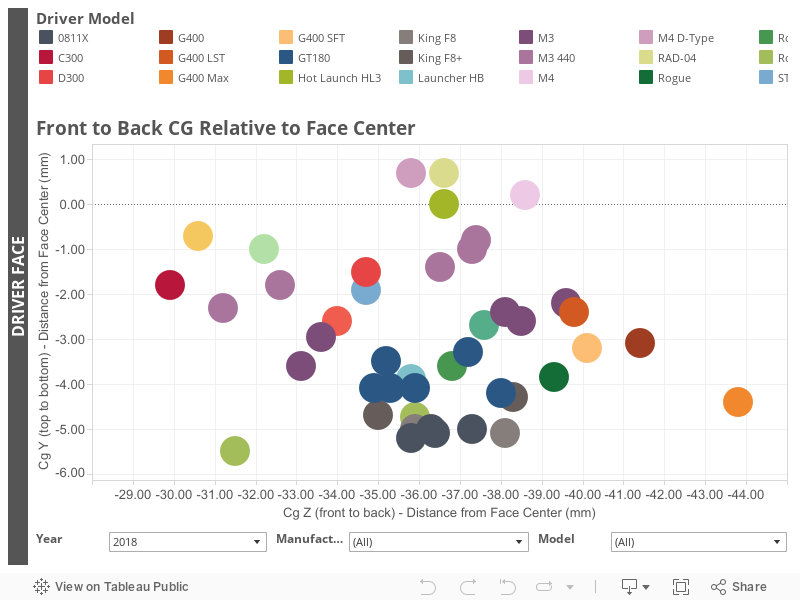
Observations
- With the M3 and M3 400, TaylorMade offers the widest range of CG movement.
- Cobra, Mizuno, and Callaway do a reasonable job of moving weight around, while PXG, despite an abundance of screws, offers comparably minimal actual adjustment capabilities.
- The Callaway Rogue Sub Zero (weight forward) is the lowest CG driver of 2018.
- No one moved top/bottom CG in any significant manner this year.
- The TaylorMade M4, TaylorMade M4 D-Type, Vega RAD-04, and Tour Edge H3 have comparably high CG locations.
- The PING G400 offers the most rearward CG, while the Wilson C300 is the most forward.
CG Relative to the NEUTRAL AXIS & MOI

As illustrated by the image above, the neutral axis is an imaginary line running perpendicular to the center of a lofted driver face. Before you ask, let me tell you why that matters. As the center of gravity moves closer to the neutral axis, you get less gearing (twisting), and a more efficient transfer of energy between the club and ball. As with everything else in our CG discussion, the distance from the center of gravity to the neutral axis (or CG NA as it’s called for short) is measured in millimeters and those millimeters matter.
Many golf companies advertise some variation of fast and forgiving, and while you might not realize it, that has everything to do with the center of gravity relative to the neutral axis. If we assume reasonably centered contact, to be fast – to reduce gearing at impact, and to maximize the efficiency of the strike – the center of gravity needs to be near the neutral axis. To be forgiving, MOI (also shown below) needs to be high. Despite what various marketing claims may lead you to believe, truly fast and truly forgiving is perhaps the most difficult combination to achieve.
Note: because both the data and the scale is fundamentally different, this chart cannot be directly compared to the Front to Back CG YZ chart above.
CGNA & MOI Chart
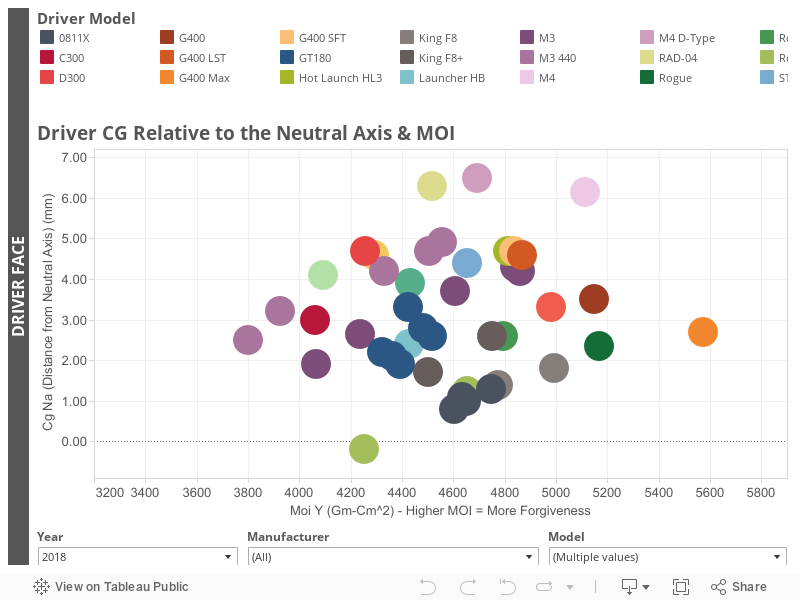
Observations
- In 2016 and 2017, several manufacturers had driven CGs below the neutral axis. This year, only the Callaway Rogue Sub Zero (weight forward) offered a below neutral CG location.
- The PXG 0811X is the next lowest (relative to the neutral axis)
- Both the TaylorMade M3 and M3 440 (with weight forward) can be considered low/forward designs
- With respect to MOI, the PING G400 MAX is in a class by itself (we had to expand the chart). While not measured, PXG’s 0811XF is reportedly nearly as forgiving. The Callaway Rogue, TaylorMade M4, and PING G400, while forgiving by any reasonable standard, don’t come close to matching G400 MAX.
- The highest CG (relative to the neutral axis) of 2018 belongs to the TaylorMade M4 D-Type. Drivers in this space generally work well for only a small segment of golfers.
- Note the lower MOI of the PING G400 SFT compared to the rest of the G400 lineup. Drivers like the SFT, Rogue Draw, and M4 D-Type offer shot shape correction (often draw bias), that correction invariably has an MOI cost.
GIVEAWAY: Titleist Driver + Fitting!
TITLEIST TS2 or TS3
Enter MyGolfSpy’s Giveaway!

CG XY (Heel/Toe CG)
While the data provided in this chart is certainly interesting, it also comes with a disclaimer of sorts. CG XY is not a straightforward measurement. For example, we mind find drivers with similar XY CG locations, yet very different face heights, face shapes, crown curvatures, bulge and roll radii, etc.. XY CG similarities aside, those other design factors will likely cause the clubs to play quite differently from one another. So while this chart will give you some indication of CG movement along the club’s x-axis as well as any inherent draw or fade bias, the CG NA and MOI chart should prove to be a much better performance comparison.
Note, the toe side is depicted on the left. CG locations left of center suggest varying degrees of fade bias, while locations depicted right of center suggest a draw bias.
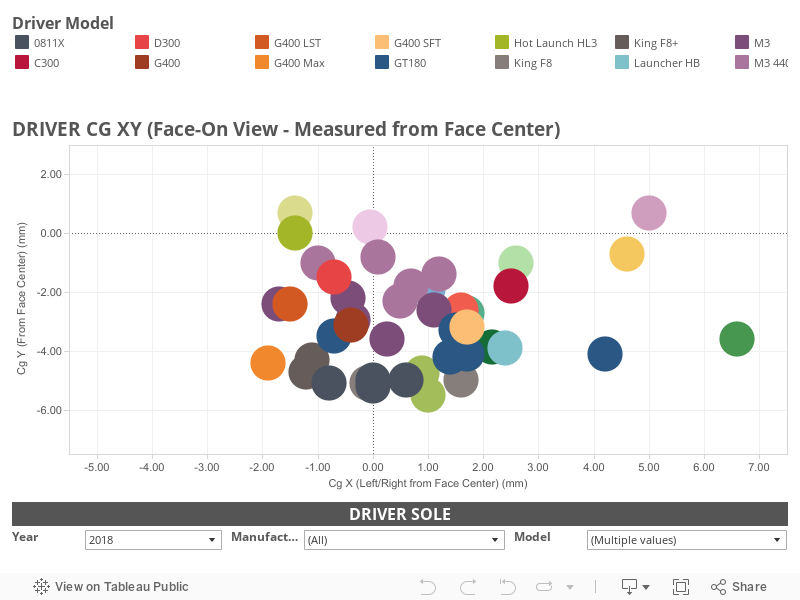
Observations
- In general, there are more fade-biased options in 2018 than past seasons.
- The draw bias (heel weighting) is readily apparent in the Rogue Draw (most draw biased), M4 D-Type, and Mizuno GT180 in the max draw position. The Bridgestone Tour XD-5 is also heavily draw baised.
- Golfers looking for a fade biased driver should consider the TaylorMade M3, PING G400 LST, Cobra F8+, and perhaps surprisingly the PING G400 MAX.
- Golfers seeking options to move between true draw and fade options should look at the TaylorMade M3/M3 440, PXG 0811X, and the Mizuno GT180.

SO WHICH CG LOCATION IS BEST?
There is no single center of gravity location that is ideal for everyone. There is no right CG or wrong CG, although I’d certainly argue that some are more niche than others, and a few are quantitatively bad for most golfers. Different manufacturers have different philosophies and different design and manufacturing capabilities. That’s a good thing because more options mean a better chance at finding the right fit.
With that said, we believe that the widest part of the bell curve will achieve the best results with relatively high MOI and low-mid CG drivers. Slower swing speed players, who need help keeping the ball in the air, generally do well with high/back designs. Golfers who are in desperate need of spin reduction (often aggressive swingers who hit down on the ball), will likely get better results with low and forward CG drivers, even at the expense of forgiveness. High MOI isn’t for everyone. For golfers who consistently hit the ball high on the face, a higher CG driver may produce better results, while golfers who habitually strike the ball low on the face will likely benefit from lower CG clubs.
As we’ve said countless times, in golf there are no absolutes, but we believe that by identifying a general center of gravity location that works well for you, you’ll be able to quickly narrow your focus to the few clubs that offer the highest probability of producing good results.
YOUR HOMEWORK
As we have in the past, we encourage you to conduct an experiment on your own. Try splitting our chart 4 ways. If you’re feeling motivated, split it 6 ways. Go out and compare clubs from the different areas you define and see if you find that clubs perform more similarly within boundaries, and quite a bit differently across them. See if the drivers in one section work better for you than those in a different area.


No comments:
Post a Comment
Thanks for engaging, We'd love to see you join our indoor golf subreddit as well https://www.reddit.com/r/Golfsimulator/